Download Understanding Picture Graph and Bar Graph Worksheets
Click the button below to get instant access to these premium worksheets for use in the classroom or at a home.

This worksheet can be edited by Premium members using the free Google Slides online software. Click the Edit button above to get started.
Download free sample
Not ready to purchase a subscription yet? Click here to download a FREE sample of this worksheet pack.
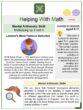
Definition:
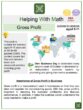
A graph is a way to represent data or information. It makes it easier for us to compare information and learn things. Graph will help us visualize the data we have.
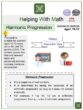
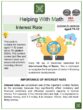
PICTURE GRAPH – This is also known as pictograph. This organizes and shows information using pictures or symbols.
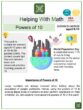
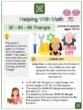
BAR GRAPH – This uses bar to show a picture of the data collected.
Understanding Picture Graph and Bar Graph Worksheets
This is a fantastic bundle which includes everything you need to know about Understanding Picture Graph and Bar Graph across 15+ in-depth pages. These are ready-to-use Common core aligned Grade 2 Math worksheets.
Each ready to use worksheet collection includes 10 activities and an answer guide. Not teaching common core standards? Don’t worry! All our worksheets are completely editable so can be tailored for your curriculum and target audience.
Resource Examples
Click any of the example images below to view a larger version.