Download Box Plots (Box and Whisker Plots) (Construction Themed) Worksheets
Click the button below to get instant access to these premium worksheets for use in the classroom or at a home.

This worksheet can be edited by Premium members using the free Google Slides online software. Click the Edit button above to get started.
Download free sample
Not ready to purchase a subscription yet? Click here to download a FREE sample of this worksheet pack.
Definition
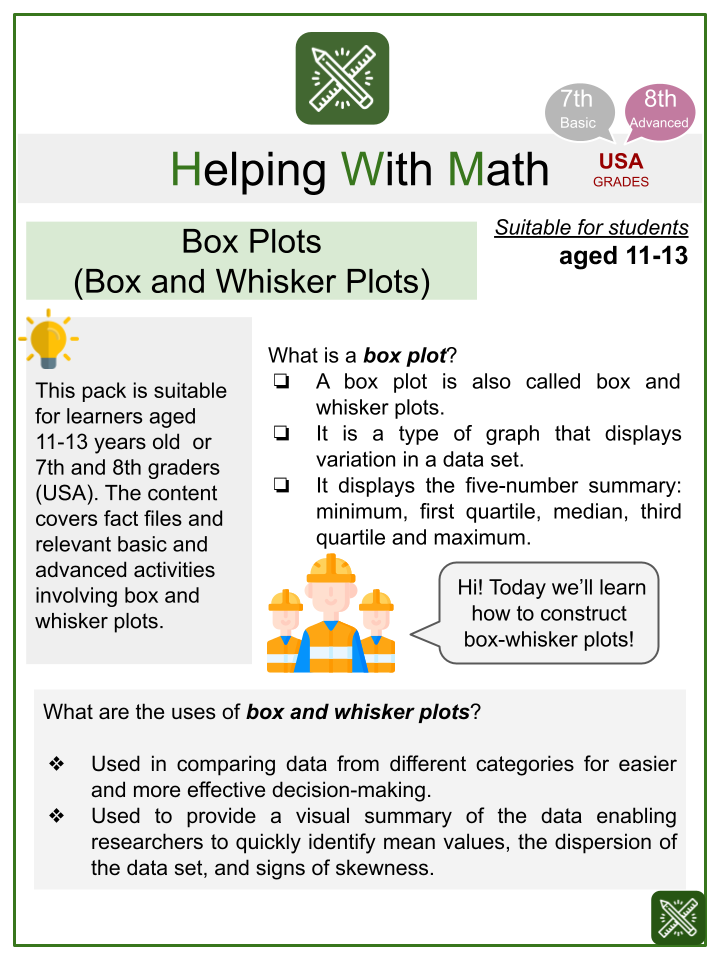
What is a box plot?
- A box plot is also called box and whisker plots.
- It is a type of graph that displays variation in a data set.
- It displays the five-number summary: minimum, first quartile, median, third quartile and maximum.
What are the uses of box and whisker plots?
- Used in comparing data from different categories for easier and more effective decision-making.
- Used to provide a visual summary of the data enabling researchers to quickly identify mean values, the dispersion of the data set, and signs of skewness.
Summary
PARTS OF A BOX-WHISKER PLOT
- MEDIAN (Q2/50th Percentile): The middle value of the dataset.
- INTERQUARTILE RANGE: 25th to the 75th percentile
- FIRST QUARTILE (Q1/25th Percentile): The middle number between the smallest number and the median of the dataset.
- THIRD QUARTILE (Q2/75th Percentile): The middle value between the median and the highest value of the dataset.
- MINIMUM The smallest number in the dataset located at the end of the left whisker.
- MAXIMUM The largest number in the dataset located at the end of the right whisker.
STEPS ON HOW TO CONSTRUCT A BOX-WHISKER PLOT
- Arrange the given data from smallest to largest.
- Find the median of the given data set. Note that the median is the mean of the middle two numbers.
- Find the quartiles. The first quartile (Q1)is the median of the data points to the left of the median. The third quartile (Q3) is the median of the data points to the right of the median.
- Identify the minimum and maximum to complete the five-number summary.
- Create a Line Plot. Scale and label it that fits the five-number summary.
- Create a box above the line plot from Q1 to Q3. Draw a vertical line through a median.
- The last step is to draw a whisker from Q1 to the minimum value and from Q3 to the maximum value.
Box Plots (Box and Whisker Plots) (Construction Themed) Worksheets
This is a fantastic bundle which includes everything you need to know about Box Plots (Box and Whisker Plots) across 21 in-depth pages. These are ready-to-use Common core aligned 7th and 8th Grade Math worksheets.
Each ready to use worksheet collection includes 10 activities and an answer guide. Not teaching common core standards? Don’t worry! All our worksheets are completely editable so can be tailored for your curriculum and target audience.
Resource Examples
Click any of the example images below to view a larger version.


Worksheets Activities Included
Ages 11-12 (Basic)
- Architect
- Construction Engineer
- My Own Construction Company
- Paolo the Drafter
- Gift to the Workers
Ages 12-13 (Advanced)
- Materials Engineer
- Build, Build, Build
- Lead Foreman
- Construction Project
- Head of Construction


