Download Representing Data using Table and Charts Worksheets
Click the button below to get instant access to these premium worksheets for use in the classroom or at a home.
This worksheet can be edited by Premium members using the free Google Slides online software. Click the Edit button above to get started.
Download free sample
Not ready to purchase a subscription yet? Click here to download a FREE sample of this worksheet pack.
Summary:
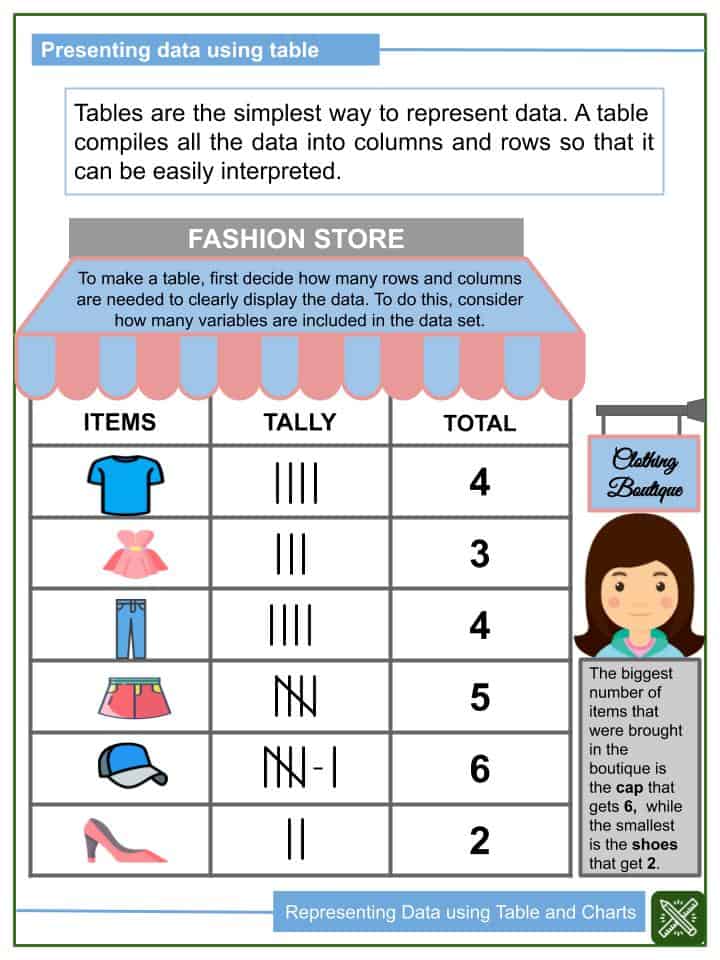
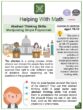
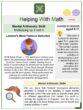
Tables, graphs, and charts are an easy way to clearly show data. These are used to organise information, to show patterns, and to present relationships.
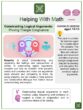
Tables are the simplest way to represent data. A table compiles all the data into columns and rows so that it can be easily interpreted.
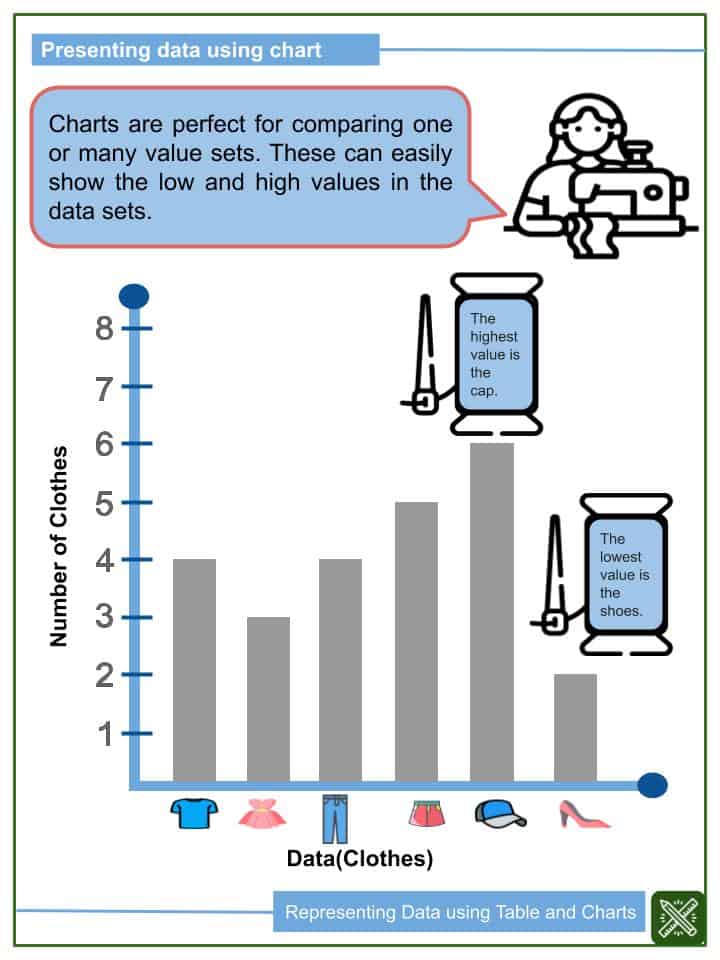
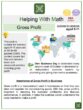
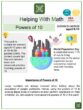
Charts are perfect for comparing one or many value sets. These can easily show the low and high values in the data sets.
Representing Data using Table and Charts Worksheets
This is a fantastic bundle which includes everything you need to know about Representing Data using Table and Charts across 15+ in-depth pages. These are ready-to-use Common core aligned Grade 1 Math worksheets.
Each ready to use worksheet collection includes 10 activities and an answer guide. Not teaching common core standards? Don’t worry! All our worksheets are completely editable so can be tailored for your curriculum and target audience.
Resource Examples
Click any of the example images below to view a larger version.